Dynamic Cross-Correlation from Normal Modes Analysis
dccm.nma.RdCalculate the cross-correlation matrix from Normal Modes Analysis.
# S3 method for nma
dccm(x, nmodes = NULL, ncore = NULL, progress = NULL, ...)
Arguments
| x | an object of class |
|---|---|
| nmodes | numerical, number of modes to consider. |
| ncore | number of CPU cores used to do the calculation.
|
| progress | progress bar for use with shiny web app. |
| ... | additional arguments ? |
Details
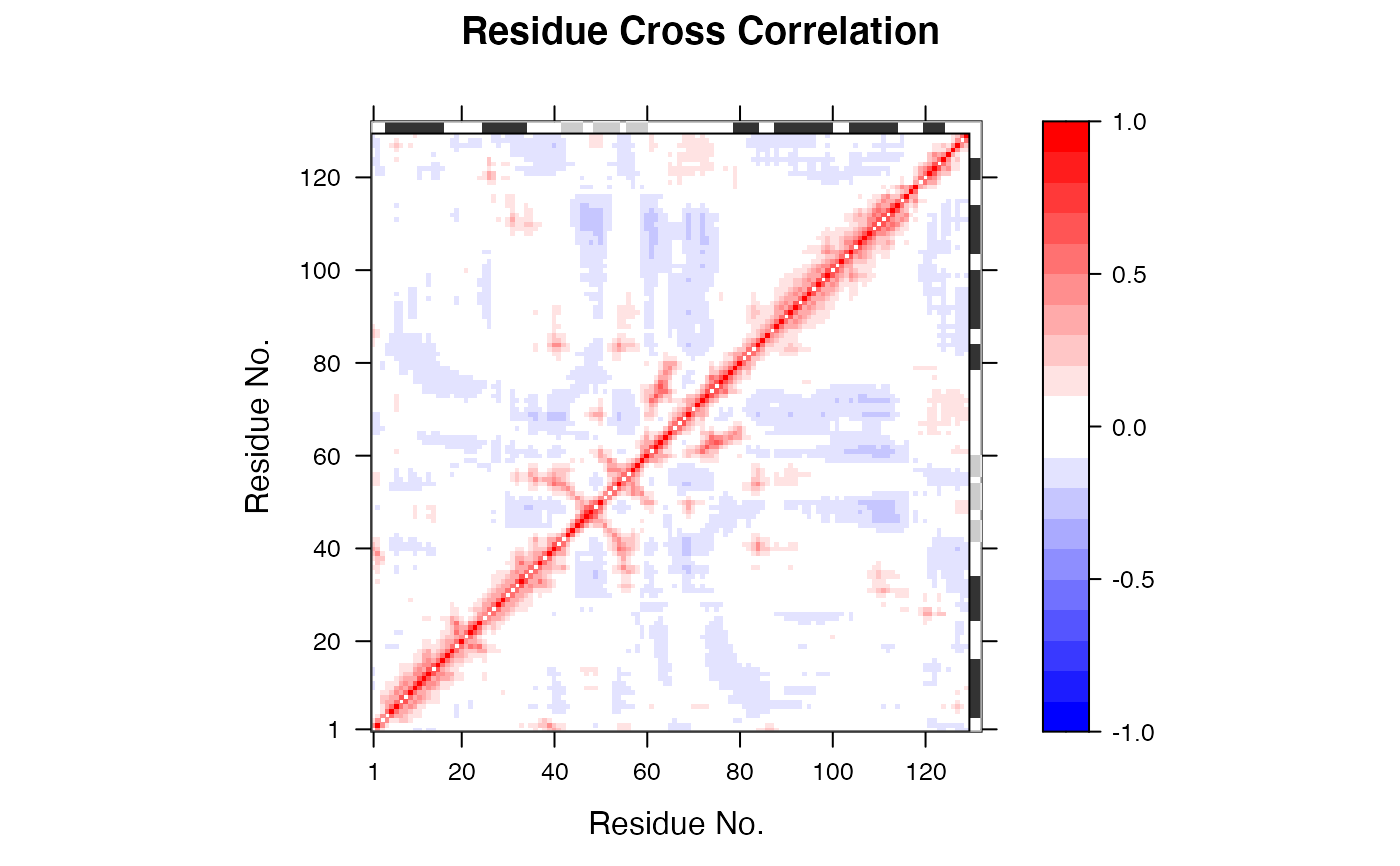
This function calculates the cross-correlation matrix from Normal
Modes Analysis (NMA) obtained from nma of a protein
structure. It returns a matrix of residue-wise cross-correlations
whose elements, Cij, may be displayed in a graphical
representation frequently termed a dynamical cross-correlation
map, or DCCM.
If Cij = 1 the fluctuations of residues i and j are completely correlated (same period and same phase), if Cij = -1 the fluctuations of residues i and j are completely anticorrelated (same period and opposite phase), and if Cij = 0 the fluctuations of i and j are not correlated.
Value
Returns a cross-correlation matrix.
References
Wynsberghe. A.W.V, Cui, Q. Structure 14, 1647--1653. Grant, B.J. et al. (2006) Bioinformatics 22, 2695--2696.
Author
Lars Skjaerven
See also
Examples
## Fetch stucture pdb <- read.pdb( system.file("examples/1hel.pdb", package="bio3d") ) ## Calculate normal modes modes <- nma(pdb)#> Building Hessian... Done in 0.014 seconds. #> Diagonalizing Hessian... Done in 0.077 seconds.## Calculate correlation matrix cm <- dccm.nma(modes)#> | |==================================================== | 74% | |==================================================== | 75% | |===================================================== | 75% | |===================================================== | 76% | |====================================================== | 77% | |====================================================== | 78% | |======================================================= | 78% | |======================================================= | 79% | |======================================================== | 79% | |======================================================== | 80% | |======================================================== | 81% | |========================================================= | 81% | |========================================================= | 82% | |========================================================== | 82% | |========================================================== | 83% | |=========================================================== | 84% | |=========================================================== | 85% | |============================================================ | 85% | |============================================================ | 86% | |============================================================= | 86% | |============================================================= | 87% | |============================================================= | 88% | |============================================================== | 88% | |============================================================== | 89% | |=============================================================== | 89% | |=============================================================== | 90% | |=============================================================== | 91% | |================================================================ | 91% | |================================================================ | 92% | |================================================================= | 92% | |================================================================= | 93% | |================================================================= | 94% | |================================================================== | 94% | |================================================================== | 95% | |=================================================================== | 95% | |=================================================================== | 96% | |==================================================================== | 96% | |==================================================================== | 97% | |==================================================================== | 98% | |===================================================================== | 98% | |===================================================================== | 99% | |======================================================================| 99% | |======================================================================| 100%## Plot correlation map plot(cm, sse = pdb, contour = FALSE, col.regions = bwr.colors(20), at = seq(-1, 1, 0.1))