DCCM: Dynamical Cross-Correlation Matrix
Usage
"dccm"(x, reference = NULL, grpby=NULL,
ncore=1, nseg.scale=1, ...)
cov2dccm(vcov, method = c("pearson", "lmi"), ncore = NULL)
Arguments
- x
- a numeric matrix of Cartesian coordinates with a row per structure/frame.
- reference
- The reference structure about which displacements are analysed.
- grpby
- a vector counting connective duplicated elements that
indicate the elements of
xyzthat should be considered as a group (e.g. atoms from a particular residue). - ncore
- number of CPU cores used to do the calculation.
ncore>1requires package ‘parallel’ installed. - nseg.scale
- split input data into specified number of segments
prior to running multiple core calculation. See
fit.xyz. - ...
- hmm.
- vcov
- numeric variance-covariance matrix.
- method
- method to calculate the cross-correlation.
Description
Determine the cross-correlations of atomic displacements.
Details
The extent to which the atomic fluctuations/displacements of a system are correlated with one another can be assessed by examining the magnitude of all pairwise cross-correlation coefficients (see McCammon and Harvey, 1986).
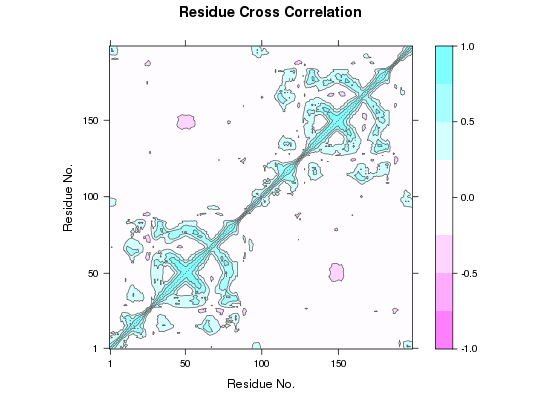
This function returns a matrix of all atom-wise cross-correlations whose elements, Cij, may be displayed in a graphical representation frequently termed a dynamical cross-correlation map, or DCCM.
If Cij = 1 the fluctuations of atoms i and j are completely correlated (same period and same phase), if Cij = -1 the fluctuations of atoms i and j are completely anticorrelated (same period and opposite phase), and if Cij = 0 the fluctuations of i and j are not correlated.
Typical characteristics of DCCMs include a line of strong cross-correlation along the diagonal, cross-correlations emanating from the diagonal, and off-diagonal cross-correlations. The high diagonal values occur where i = j, where Cij is always equal to 1.00. Positive correlations emanating from the diagonal indicate correlations between contiguous residues, typically within a secondary structure element or other tightly packed unit of structure. Typical secondary structure patterns include a triangular pattern for helices and a plume for strands. Off-diagonal positive and negative correlations may indicate potentially interesting correlations between domains of non-contiguous residues.
cov2dccm function calculates the N-by-N cross-correlation matrix
directly from a 3N-by-3N variance-covariance matrix.
If method = "pearson", the conventional Pearson's inner-product
correlaiton calculation will be invoked, in which only the diagnol of
each residue-residue covariance sub-matrix is considered.
If method = "lmi", then the linear mutual information
cross-correlation will be calculated. ‘LMI’ considers both
diagnol and off-diagnol entries in sub-matrices, and so even grabs the
correlation of residues moving on orthognal directions. (See more details
in lmi.)
Value
-
Returns a cross-correlation matrix.
References
Grant, B.J. et al. (2006) Bioinformatics 22, 2695--2696.
McCammon, A. J. and Harvey, S. C. (1986) Dynamics of Proteins and Nucleic Acids, Cambridge University Press, Cambridge.
Lange, O.F. and Grubmuller, H. (2006) PROTEINS: Structure, Function, and Bioinformatics 62:1053--1061.
Examples
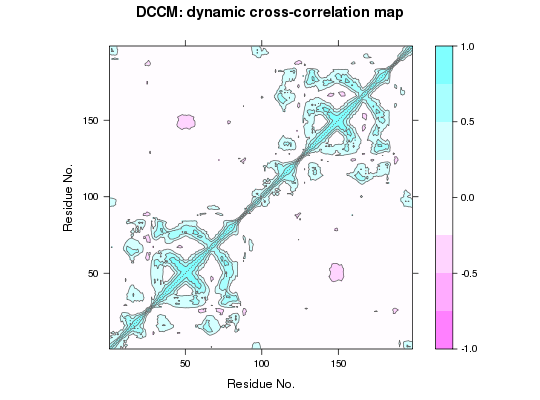
##-- Read example trajectory file trtfile <- system.file("examples/hivp.dcd", package="bio3d") trj <- read.dcd(trtfile)NATOM = 198 NFRAME= 117 ISTART= 0 last = 117 nstep = 117 nfile = 117 NSAVE = 1 NDEGF = 0 version 24 Reading (x100) |======================================================================| 100%## Read the starting PDB file to determine atom correspondence pdbfile <- system.file("examples/hivp.pdb", package="bio3d") pdb <- read.pdb(pdbfile) ## select residues 24 to 27 and 85 to 90 in both chains inds <- atom.select(pdb, resno=c(24:27,85:90), elety='CA') ## lsq fit of trj on pdb xyz <- fit.xyz(pdb$xyz, trj, fixed.inds=inds$xyz, mobile.inds=inds$xyz) ## DCCM (slow to run so restrict to Calpha) cij <- dccm(xyz) ## Plot DCCM plot(cij) ## Or library(lattice)
contourplot(cij, region = TRUE, labels=FALSE, col="gray40", at=c(-1, -0.75, -0.5, -0.25, 0.25, 0.5, 0.75, 1), xlab="Residue No.", ylab="Residue No.", main="DCCM: dynamic cross-correlation map")