LMI: Linear Mutual Information Matrix
Usage
lmi(trj, grpby=NULL, ncore=1)
Arguments
- trj
- a numeric matrix of Cartesian coordinates with a row per structure/frame.
- grpby
- a vector counting connective duplicated elements that
indicate the elements of
trjthat should be considered as a group (e.g. atoms from a particular residue). - ncore
- number of CPU cores used to do the calculation.
ncore>1requires package ‘parallel’ installed.
Description
Calculate the linear mutual information correlations of atomic displacements.
Details
The correlation of the atomic fluctuations of a system can be assessed by the Linear Mutual Information (LMI) and the LMI has no unwanted dependency on the relative orientation of the fluctuations which the Pearson coefficient suffers from.
This function returns a matrix of all atom-wise linear mutual information whose elements are denoted as Cij. If Cij = 1, the fluctuations of atoms i and j are completely correlated and if Cij = 0, the fluctuations of atoms i and j are not correlated.
Value
-
Returns a linear mutual information matrix.
References
Grant, B.J. et al. (2006) Bioinformatics 22, 2695--2696. Lange, O.F. and Grubmuller, H. (2006) PROTEINS: Structure, Function, and Bioinformatics 62:1053--1061.
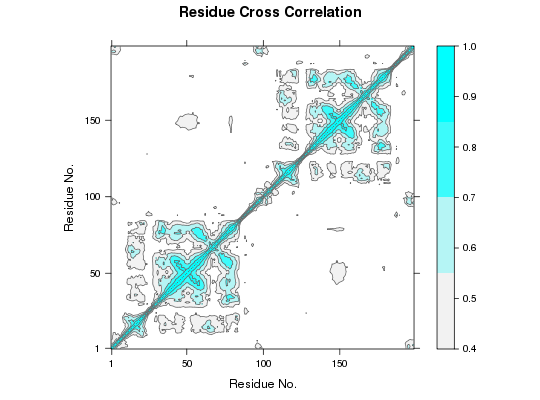
Examples
# Redundant testing excluded ##-- Read example trajectory file trtfile <- system.file("examples/hivp.dcd", package="bio3d") trj <- read.dcd(trtfile)NATOM = 198 NFRAME= 117 ISTART= 0 last = 117 nstep = 117 nfile = 117 NSAVE = 1 NDEGF = 0 version 24 Reading (x100) |======================================================================| 100%## Read the starting PDB file to determine atom correspondence pdbfile <- system.file("examples/hivp.pdb", package="bio3d") pdb <- read.pdb(pdbfile) ## select residues 24 to 27 and 85 to 90 in both chains inds <- atom.select(pdb, resno=c(24:27,85:90), elety='CA') ## lsq fit of trj on pdb xyz <- fit.xyz(pdb$xyz, trj, fixed.inds=inds$xyz, mobile.inds=inds$xyz) ## LMI matrix (slow to run so restrict to Calpha) cij <- lmi(xyz) ## Plot LMI matrix #plot(cij) col.scale <- colorRampPalette(c("gray95", "cyan"))(5) plot(cij, at=seq(0.4,1, length=5), col.regions=col.scale)