Plot Fluctuations
Usage
"plot"(x, col = NULL, label = rownames(x), signif = FALSE, p.cutoff = 0.005, q.cutoff = 0.04, s.cutoff = 5, n.cutoff = 2, mean = FALSE, polygon = FALSE, spread = FALSE, offset = 1, ncore = NULL, ...)
Arguments
- x
- a numeric vector or matrix containing atomic fluctuation data obtained
from e.g.
nma.pdbsorrmsf. - col
- a character vector of plotting colors. Used also to group fluctuation profiles. NA values in col will omit the corresponding fluctuation profile in the plot.
- label
- a character vector of plotting labels with length matching
nrow(x). Ifmean=TRUE, the length oflabelcan be equal to the number of categories indicated bycol. - signif
- logical, if TRUE significance of fluctuation difference is calculated and annotated for each atomic position.
- p.cutoff
- Cutoff of p-value to define significance.
- q.cutoff
- Cutoff of the mean fluctuation difference to define significance.
- s.cutoff
- Cutoff of sample size in each group to calculate the significance.
- n.cutoff
- Cutoff of consecutive residue positions with significant fluctuation difference. If the actual number is less than the cutoff, correponding postions will not be annotated.
- mean
- logical, if TRUE plot mean fluctuations of each group. Significance is still calculated with the original data.
- polygon
- logical, if TRUE a nicer plot with area under the line for the first
row of
xare filled with polygons. - ncore
- number of CPU cores used to do the calculation. By default
(
ncore=NULL), use all available CPU cores. The argument is only used whensignif=TRUE. - spread
- logical, if TRUE the fluctuation profiles are spread - i.e. not on top of each other.
- offset
- numerical offset value in use when ‘spread=TRUE’.
- ...
- extra plotting arguments passed to
plot.bio3d.
Description
Produces a plot of atomic fluctuations obtained from ensemble normal mode analysis or molecular dynamics simulations.
Details
The significance calculation is performed when signif=TRUE and there are at least
two groups with sample size larger than or equal to s.cutoff. A "two-sided"
student's t-test is performed for each atomic position (each
column of x). If x contains gaps, indicated by NAs,
only non-gapped positions are considered. The position is considered significant if both
p-value <= p.cutoff and the mean value difference of the two groups, q, satisfies
q >= q.cutoff. If more than two groups are available, every pair of groups are
subjected to the t-test calculation and the minimal p-value along with the q-value
for the corresponding pair are used for the significance evaluation.
Value
-
If significance is calculated, return a vector indicating significant positions.
References
Grant, B.J. et al. (2006) Bioinformatics 22, 2695--2696.
Examples
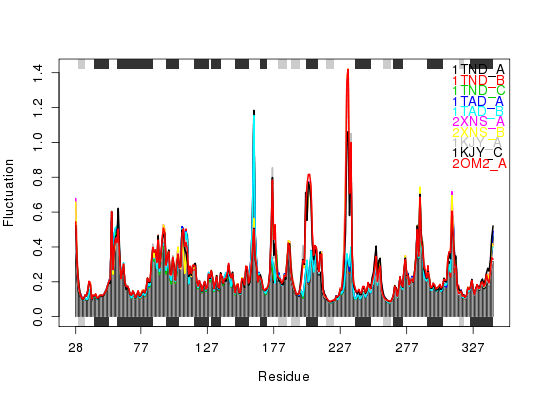
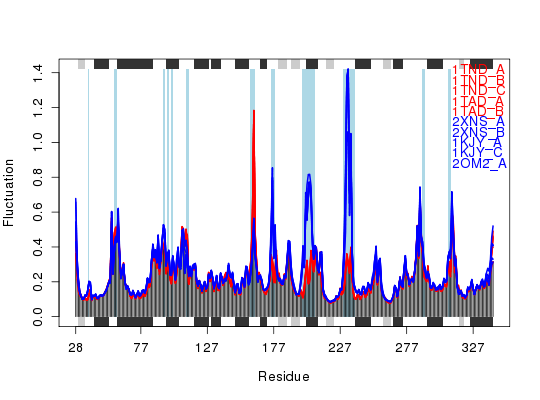
## load transducin example data attach(transducin) ## subset of pdbs to analyze inds = c(1:5, 16:20) pdbs <- trim(pdbs, row.inds=inds) gaps.res = gap.inspect(pdbs$ali) ## reference RESNO and SSE for axis annotations resno <- pdbs$resno[1, gaps.res$f.inds] sse <- pdbs$sse[1, gaps.res$f.inds] ## eNMA calculation and obtain modes of motion including atomic fluctuations modes <- nma(pdbs, ncore=NULL)Details of Scheduled Calculation: ... 10 input structures ... storing 939 eigenvectors for each structure ... dimension of x$U.subspace: ( 945x939x10 ) ... coordinate superposition prior to NM calculation ... aligned eigenvectors (gap containing positions removed) ... estimated memory usage of final 'eNMA' object: 67.8 Mb | | | 0%x = modes$fluctuation ## simple line plot with SSE annotation plot.fluct(x, sse=sse, resno=resno) ## group data by specifying colors of each fluctuation line; same color indicates ## same group. Also do significance calculation and annotation col = c(rep('red', 5), rep('blue', 5))
plot.fluct(x, col=col, signif=TRUE, sse=sse, resno=resno)
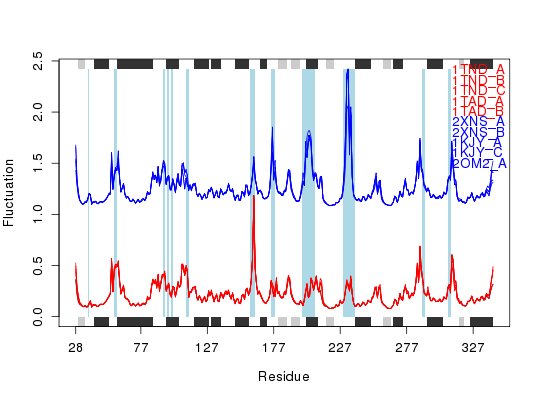
## spread lines plot.fluct(x, col=col, signif=TRUE, sse=sse, resno=resno, typ='l', spread=TRUE)
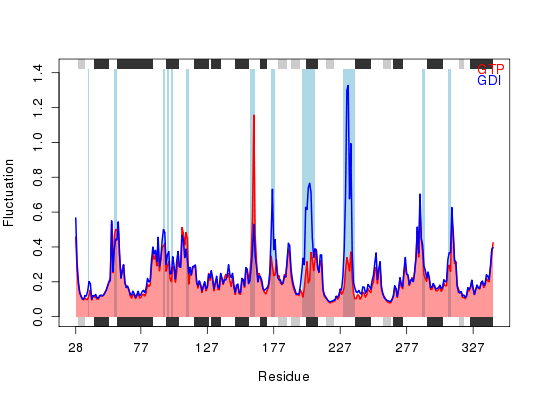
## show only line of mean values for each group. ## Nicer plot with area shaded for the first group. plot.fluct(x, col=col, signif=TRUE, sse=sse, resno=resno, mean=TRUE, polygon=TRUE, label=c('GTP', 'GDI'))
detach(transducin)
See also
plot.bio3d, rmsf, nma.pdbs,
t.test, polygon.