Percent Identity
Usage
seqidentity(alignment, normalize=TRUE, similarity=FALSE, ncore=1, nseg.scale=1)
Arguments
- alignment
- sequence alignment obtained from
read.fastaor an alignment character matrix. - normalize
- logical, if TRUE output is normalized to values between 0 and 1 otherwise percent identity is returned.
- similarity
- logical, if TRUE sequence similarity is calculated instead of identity.
- ncore
- number of CPU cores used to do the calculation.
ncore>1requires package ‘parallel’ installed. - nseg.scale
- split input data into specified number of segments
prior to running multiple core calculation. See
fit.xyz.
Description
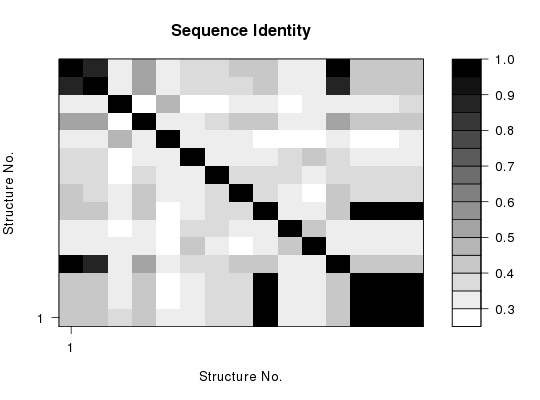
Determine the percent identity scores for aligned sequences.
Details
The percent identity value is a single numeric score determined for each pair of aligned sequences. It measures the number of identical residues (“matches”) in relation to the length of the alignment.
Value
-
Returns a numeric matrix with all pairwise identity values.
References
Grant, B.J. et al. (2006) Bioinformatics 22, 2695--2696.
Examples
attach(kinesin)The following objects are masked from transducin: annotation, core, pdbside.mat <- seqidentity(pdbs) # Plot identity matrix plot.dmat(ide.mat, color.palette=mono.colors, main="Sequence Identity", xlab="Structure No.", ylab="Structure No.") # Histogram of pairwise identity values hist(ide.mat[upper.tri(ide.mat)], breaks=30,xlim=c(0,1), main="Sequence Identity", xlab="Identity")
# Compare two sequences seqidentity( rbind(pdbs$ali[1,], pdbs$ali[15,]) )[,1] [,2] [1,] 1.000 0.461 [2,] 0.461 1.000detach(kinesin)