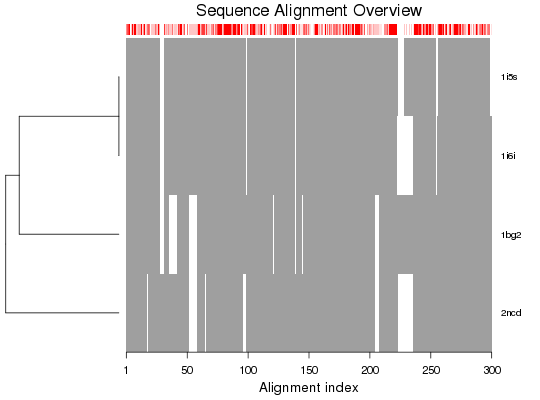
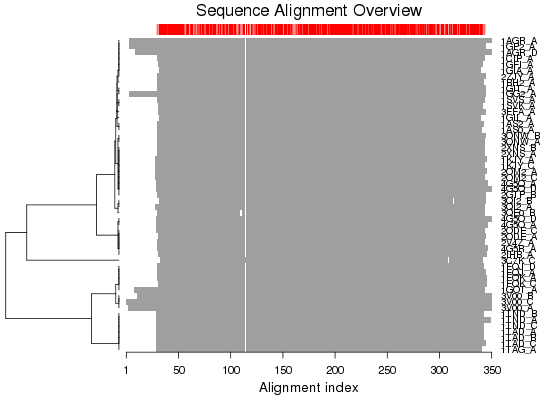
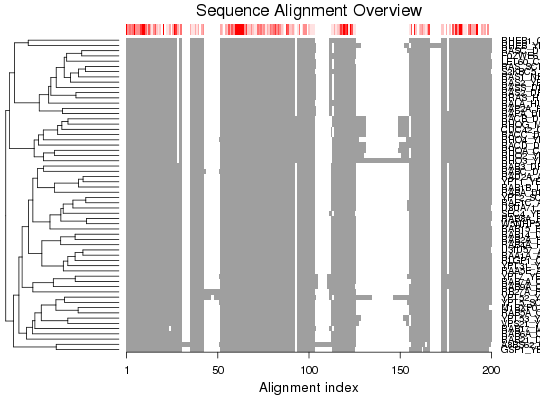
Plot a Multiple Sequence Alignment
Usage
"plot"(x, hc = TRUE, labels = x$id, cex.lab = 0.7, xlab = "Alignment index", main = "Sequence Alignment Overview", mar4 = 4, ...)
Arguments
- x
- multiple sequence alignement of class ‘fasta’ as
obtained from
seqaln. - hc
- logical, if TRUE plot a dendrogram on the left
side. Alternatively, an object obtained from
hclustcan be provided. - labels
- labels corresponding to each row in the alignment.
- cex.lab
- scaling factor for the labels.
- xlab
- label for x-axis.
- main
- a main title for the plot.
- mar4
- margin size for the labels.
- ...
- additional arguments passed to function
hclust.
Description
Produces a schematic representation of a multiple sequence alignment.
Details
plot.fasta is a utility function for producting a schematic
representation of a multiple sequence alignment.
Value
-
Called for its effect.
References
Grant, B.J. et al. (2006) Bioinformatics 22, 2695--2696.
Examples
# Read alignment
aln <- read.fasta(system.file("examples/kif1a.fa",package="bio3d"))

## alignment plot
plot(aln, labels=basename.pdb(aln$id))

## Works also for a 'pdbs' object
attach(transducin)
plot(pdbs)


detach(transducin)

infile <- "http://pfam.xfam.org/family/PF00071/alignment/seed/format?format=fasta"
aln <- read.fasta( infile )
plot(aln)