Identify Points in a CNA Protein Structure Network Plot
Usage
"identify"(x, labels=NULL, cna=NULL, ...)
Arguments
- x
- A numeric matrix with Nx2 dimensions, where N is equal to the number of objects in a 2D CNA plot such as obtained from the ‘plot.cna’ and various ‘layout’ functions.
- labels
- An optional character vector giving labels for the points. Will be coerced using ‘as.character’, and recycled if necessary to the length of ‘x’. Excess labels will be discarded, with a warning.
- cna
- A network object as returned from the ‘cna’ function.
- ...
- Extra options passed to ‘identify’ function.
Description
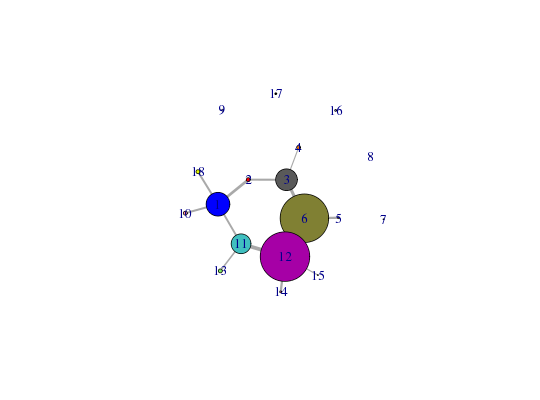
‘identify.cna’ reads the position of the graphics pointer when the (first) mouse button is pressed. It then searches the coordinates given in ‘x’ for the point closest to the pointer. If this point is close enough to the pointer, its index and community members will be returned as part of the value of the call and the community members will be added as labels to the plot.
Details
This function calls the ‘identify’ and ‘summary.cna’ functions to query and label 2D CNA protein structure network plots produced by the ‘plot.cna’ function. Clicking with the mouse on plot points will add the corresponding labels and them to the plot and returned list object. A click with the right mouse button will stop the function.
Value
-
If ‘labels’ or ‘cna’ inputs are provided then a membership vector
will be returned with the selected community ids and their members. Otherwise a
vector with the ids of the selected communities will be returned.
Examples
attach(hivp) # Read the starting PDB file to determine atom correspondence pdbfile <- system.file("examples/hivp.pdb", package="bio3d") pdb <- read.pdb(pdbfile) # Plot the network xy <- plot.cna(net)Obtaining estimated layout with fruchterman.reingold# Use identify.cna on the communities ## <strong>Not run</strong>: # d <- identify.cna(xy, cna=net) # ## <strong>End(Not run)</strong> # Right click to end the function... ## d <- identify(xy, summary(net)$members) detach(hivp)
See also
plot.cna, identify, plot.igraph, plot.communities, igraph.plotting