Suboptimal Path Analysis for Correlation Networks
Usage
cnapath(cna, from, to=NULL, k=10, collapse=TRUE, ncore=NULL, ...)
"summary"(object, ..., pdb = NULL, label = NULL, col = NULL, plot = FALSE, concise = FALSE, cutoff = 0.1, normalize = TRUE, weight = FALSE)
"print"(x, ...)
Arguments
- cna
- A ‘cna’ object obtained from
cna. - from
- Integer vector or matrix indicating node id(s) of source. If is matrix
and
tois NULL, the first column represents source and the second sink. - to
- Integer vector indicating node id(s) of sink. All combinations of
fromandtovalues will be used as source/sink pairs. - k
- Integer, number of suboptimal paths to identify.
- collapse
- Logical, if TRUE results from all source/sink pairs are merged with a single ‘cnapath’ object returned.
- ncore
- Number of CPU cores used to do the calculation. By default (NULL), use all detected CPU cores.
- object
- A ‘cnapath’ class of object obtained from
cnapath. Multiple ‘object’ input is allowed for comparing paths from different networks. - pdb
- A ‘pdb’ class of object obtained from
read.pdband is used as the reference for node residue ids (insummary.cnapath) or for molecular visulaization with VMD (invmd.cnapath). - label
- Character, label for paths identified from different networks.
- col
- Colors for plotting statistical results for paths identified from different networks.
- plot
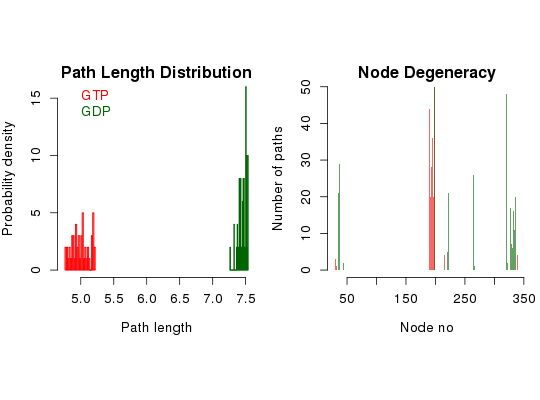
- Logical, if TRUE path length distribution and node degeneracy will be plotted.
- concise
- Logical, if TRUE only ‘on path’ residues will be displayed in the node degeneracy plot.
- cutoff
- Numeric, nodes with node degeneracy larger than
cutoffare shown in the output. - normalize
- Logical, if TRUE node degeneracy is divided by the total (weighted) number of paths.
- weight
- Logical, if TRUE each path is weighted by path length in calculating the node degeneracty.
- x
- A 'cnapath' class object as obtained from function
cna. - ...
- Additional arguments passed to igraph function
get.shortest.paths(in the functioncnapath), passed tosummary.cnapath(inprint.cnapath), as additional paths for comparison (insummary.cnapath).
Description
Find k shortest paths between a pair of nodes, source and sink, in a correlation network.
Value
-
The function
- path
- a list object containing all identified suboptimal paths. Each entry of the list is a sequence of node ids for the path.
- epath
- a list object containing all identified suboptimal paths. Each entry of the list is a sequence of edge ids for the path.
- dist
- a numeric vector of all path lengths.
cnapath returns a ‘cnapath’ class of list containing
following three components:
The function summary.cnapath returns a matrix of (normalized)
node degeneracy for ‘on path’ residues.
References
Yen, J.Y. (1971) Management Science 17, 712--716.
Examples
# Redundant testing excluded attach(transducin) inds = match(c("1TND_A", "1TAG_A"), pdbs$id) npdbs <- trim(pdbs, row.inds=inds) gaps.res <- gap.inspect(npdbs$ali) modes <- nma(npdbs)Details of Scheduled Calculation: ... 2 input structures ... storing 936 eigenvectors for each structure ... dimension of x$U.subspace: ( 942x936x2 ) ... coordinate superposition prior to NM calculation ... aligned eigenvectors (gap containing positions removed) ... estimated memory usage of final 'eNMA' object: 13.5 Mb |======================================================================| 100%cij <- dccm(modes) net <- cna(cij, cutoff.cij=0.3) # get paths pa1 <- cnapath(net[[1]], from = 314, to=172, k=50) pa2 <- cnapath(net[[2]], from = 314, to=172, k=50) # print the information of a path pa1Number of paths in network(s): 50 Path length distribution: [4.77,4.86] (4.86,4.94] (4.94,5.03] (5.03,5.12] (5.12,5.2] 8 11 11 9 11 Node degeneracy table: 5 164 165 166 167 168 169 170 171 172 314 0.12 0.88 0.50 0.40 0.56 0.70 0.72 1.00 0.40 1.00 1.00# print two paths simultaneously pas <- list(pa1, pa2) names(pas) <- c("GTP", "GDP") print.cnapath(pas)Number of networks: 2 ( GTP, GDP ) Number of paths in network(s): GTP: 50 GDP: 50 Path length distribution: --- GTP --- [4.77,4.86] (4.86,4.94] (4.94,5.03] (5.03,5.12] (5.12,5.2] 8 11 11 9 11 --- GDP --- [7.27,7.32] (7.32,7.37] (7.37,7.43] (7.43,7.48] (7.48,7.54] 1 5 10 13 21 Node degeneracy table: 5 10 11 14 164 165 166 167 168 169 170 171 172 194 195 GTP 0.12 0.00 0.00 0.00 0.88 0.50 0.40 0.56 0.70 0.72 1.00 0.40 1.00 0.00 0.00 GDP 0.00 0.42 0.58 0.60 0.00 0.00 0.00 0.00 0.00 0.00 0.00 0.00 1.00 0.10 0.30 196 239 295 301 302 303 304 305 306 307 308 310 311 314 GTP 0.00 0.00 0.00 0.00 0.00 0.00 0.00 0.00 0.00 0.00 0.00 0.00 0.00 1.00 GDP 0.42 0.52 0.96 0.34 0.68 0.14 0.24 0.12 0.32 0.54 0.22 0.40 0.64 1.00# Or, for the same effect, # summary(pa1, pa2, label=c("GTP", "GDP")) # replace node numbers with residue name and residue number in the PDB file pdb <- read.pdb("1tnd")Note: Accessing on-line PDB filepdb <- trim.pdb(pdb, atom.select(pdb, chain="A", resno=npdbs$resno[1, gaps.res$f.inds])) print.cnapath(pas, pdb=pdb)Number of networks: 2 ( GTP, GDP ) Number of paths in network(s): GTP: 50 GDP: 50 Path length distribution: --- GTP --- [4.77,4.86] (4.86,4.94] (4.94,5.03] (5.03,5.12] (5.12,5.2] 8 11 11 9 11 --- GDP --- [7.27,7.32] (7.32,7.37] (7.37,7.43] (7.43,7.48] (7.48,7.54] 1 5 10 13 21 Node degeneracy table: K31 G36 A37 S40 L190 N191 F192 R193 M194 F195 D196 V197 G198 I220 A221 GTP 0.12 0.00 0.00 0.00 0.88 0.50 0.40 0.56 0.70 0.72 1.00 0.40 1.00 0.00 0.00 GDP 0.00 0.42 0.58 0.60 0.00 0.00 0.00 0.00 0.00 0.00 0.00 0.00 1.00 0.10 0.30 A222 N265 C321 N327 V328 K329 F330 V331 F332 D333 A334 T336 D337 I340 GTP 0.00 0.00 0.00 0.00 0.00 0.00 0.00 0.00 0.00 0.00 0.00 0.00 0.00 1.00 GDP 0.42 0.52 0.96 0.34 0.68 0.14 0.24 0.12 0.32 0.54 0.22 0.40 0.64 1.00# plot path length distribution and node degeneracy print.cnapath(pas, pdb = pdb, col=c("red", "darkgreen"), plot=TRUE) # View paths in 3D molecular graphic with VMD #vmd.cnapath(pa1, pdb, launch = TRUE) #vmd.cnapath(pa1, pdb, colors = 7, launch = TRUE) #vmd.cnapath(pa1, pdb, spline=TRUE, colors=c("pink", "red"), launch = TRUE) #pdb2 <- read.pdb("1tag") #pdb2 <- trim.pdb(pdb2, atom.select(pdb2, chain="A", resno=npdbs$resno[2, gaps.res$f.inds])) #vmd.cnapath(pa2, pdb2, launch = TRUE) detach(transducin)