Plot a Summary of HMMER Hit Statistics.
Usage
"plot"(x, ...)
Arguments
- x
- HMMER results as obtained from the function
hmmer. - ...
- arguments passed to
plot.blast.
Description
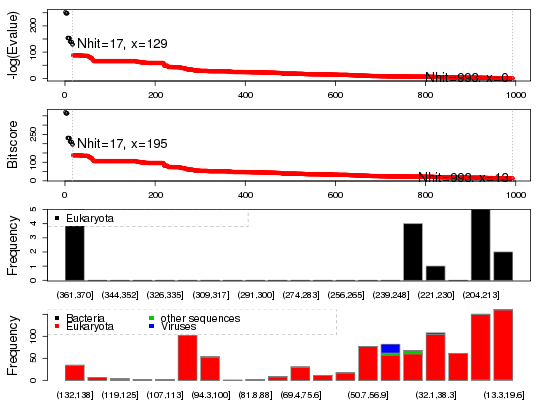
Produces a number of basic plots that should facilitate hit selection from the match statistics of a HMMER result.
Details
See plot.blast for details.
Value
-
Produces a plot on the active graphics device and returns a three
component list object:
- hits
- an ordered matrix detailing the subset of hits with a normalized score above the chosen cutoff. Database identifiers are listed along with their cluster group number.
- acc
- a character vector containing the database accession identifier of each hit above the chosen threshold.
- pdb.id
- a character vector containing the database accession identifier of each hit above the chosen threshold.
- inds
- a numeric vector containing the indices of the hits relative to the input hmmer object.
References
Grant, B.J. et al. (2006) Bioinformatics 22, 2695--2696.
Examples
# HMMER server connection required - testing excluded ##- PHMMER seq <- get.seq("2abl_A", outfile = tempfile()) res <- hmmer(seq, db="pdb") plot.hmmer(res)* Possible cutoff values: 128 0 Yielding Nhits: 17 993 * Chosen cutoff value of: 128 Yielding Nhits: 17