Dendrogram with Clustering Annotation
Usage
hclustplot(hc, k = NULL, h = NULL, colors = NULL, labels = NULL, fillbox = FALSE, heights = c(1, .3), mar = c(1, 1, 0, 1), ...)
Arguments
- hc
- an object of the type produced by
hclust. - k
- an integer scalar or vector with the desired number of
groups. Redirected to function
cutree. - h
- numeric scalar or vector with heights where the tree should
be cut. Redirected to function
cutree. At least one of ‘k’ or ‘h’ must be specified. - colors
- a numerical or character vector with the same length as ‘hc’ specifying the colors of the labels.
- labels
- a character vector with the same length as ‘hc’ containing the labels to be written.
- fillbox
- logical, if TRUE clustering annotation will be drawn as filled boxes below the dendrogram.
- heights
- numeric vector of length two specifying the values for
the heights of rows on the device. See function
layout. - mar
- a numerical vector of the form ‘c(bottom, left, top, right)’ which gives the number of lines of margin to be specified on the four sides of the plot. If left at default the margins will be adjusted upon adding arguments ‘main’, ‘ylab’, etc.
- ...
- other graphical parameters passed to functions
plot.dendrogram,mtext, andpar. Note that certain arguments will be ignored.
Description
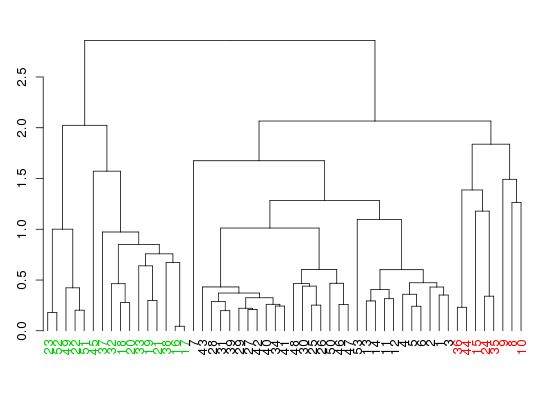
Draw a standard dendrogram with clustering annotation in the marginal regions and colored labels.
Details
This function adds extended visualization of cluster membership to a
standard dendrogram. If ‘k’ or ‘h’ is provided a call to
cutree will provide cluster membership
information. Alternatively a vector of colors or cluster membership
information can be provided through argument ‘colors’.
See examples for further details on usage.
Note
Argument ‘horiz=TRUE’ currently not supported.
Value
-
Called for its effect.
References
Grant, B.J. et al. (2006) Bioinformatics 22, 2695--2696.
Examples
# Redundant testing excluded attach(transducin) ##- perform RMSD clustering rd <- rmsd(pdbs, fit=TRUE)Warning message: No indices provided, using the 305 non NA positionshc <- hclust(as.dist(rd)) ##- draw dendrogram hclustplot(hc, k=3) ##- draw dendrogram with manual clustering annotation #hclustplot(hc, colors=annotation[, "color"], labels=pdbs$id) detach(transducin)